Debugger is developers best friend. If you have to be efficient you have to know how to debug your application. No amount of logs, traces, console output can help you as much as live debugger session could. You have to know how to debug locally or remotely.
Most development environments (Visual Studio, IntelliJ Idea, Android Studio, XCode) allows you to debug right in the studio, but we will start with stand alone tool, which could be used on any machine without installation – WinDbg. You can get it from Microsoft site here.
(On Unix/Linux systems it’s even easies, debugger – dbg – it part of development environment.)
So let’s start with sample application. We will take sample from my Hello, World on C/C++ on Windows, part II and will change it a little bit:
#include <stdio.h>
#include <windows.h>
#include <iostream>

void printFile(const char* const str)
{
	HANDLE hFile = ::CreateFile(str, GENERIC_READ, FILE_SHARE_READ, NULL, OPEN_EXISTING, FILE_ATTRIBUTE_NORMAL, NULL);
	if (INVALID_HANDLE_VALUE == hFile)
	{
		std::cout << "Failed to open file. Error: " << GetLastError() << std::endl;
	}
	else
	{
		const DWORD dwBuf{ 512 };
		char buf[dwBuf];
		DWORD dwRead{ 0 };
		while (::ReadFile(hFile, buf, dwBuf-1, &dwRead, NULL) && 0 != dwRead)
		{
			buf[dwRead] = 0;
			std::cout << buf;
		}
		std::cout << std::endl;
                ::CloseHandle(hFile);
	}
}

int main(int argc, char* argv[])
{
	int nDesiredNumberOfArguments = 1;

	if(argc < nDesiredNumberOfArguments)
	{
		std::cout << "Usage: PrintFile.exe <file name>" << std::endl;
		return 1;
	}

	printFile(argv[1]);

	return 0;
}
To build it we will use slightly modified version of command from that post:
cl.exe /W4 /EHsc /Zi PrintFile.cpp /link Kernel32.lib /subsystem:console /out:PrintFile.exe /pdb:PrintFile.dgb
Major change is that we add new output parameter PrintFile.pdb.
You can think of pdb file as a dictionary between executable file which is written in language which computer could understand only and source code, which is human readable format (and I hope that’s exactly how you write your code).
If you disassemble executable you won’t see functions names, variables etc. but pdb file keeps this information, so debugger could use it to present to you readable data.
So let’s follow the logic of our application: first it checks if there is a command line parameter and if not it should show how to use it and exit; if file name was specified call function to print file content to standard output.
But if you run this application like this:
PrintFile.exe
instead of “Usage…” message you will get an error. Somewhere we made an error. Well I hope you don’t really need debugger for this as this is too obvious error, but let try to debug it.
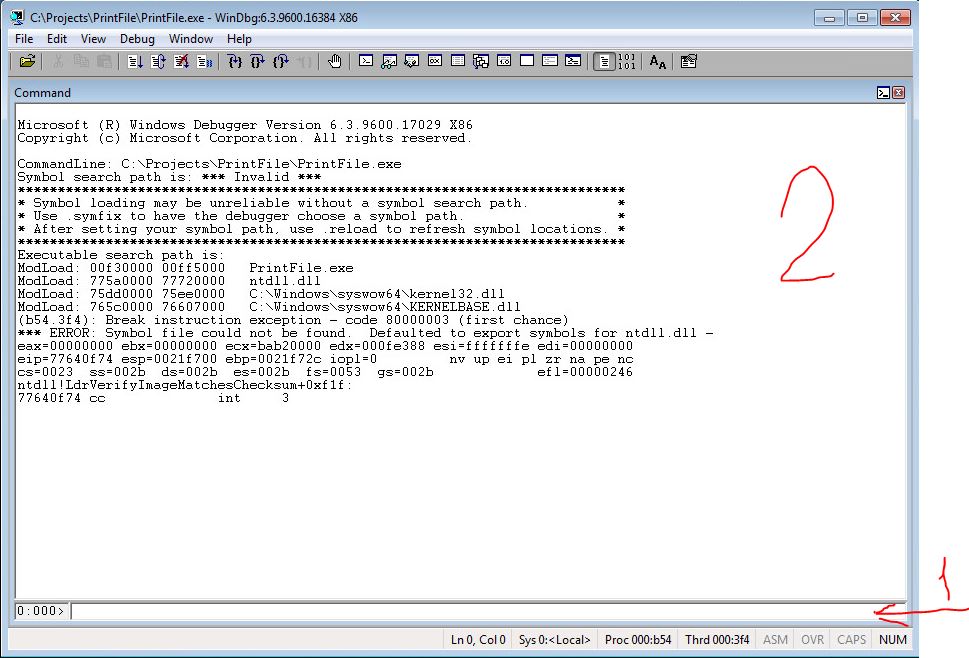
Go to the folder where you put your WinDbg and run windbg.exe.
Go to File menu and select Open Executable…, browse to your project folder and select PrintFile.exe
WinDbg very powerful tool and we won’t go into deep details and concentrate on its main window.
It similar to command line, but you type your command at the bottom portion of the window (1) and all output goes in top portion (2).
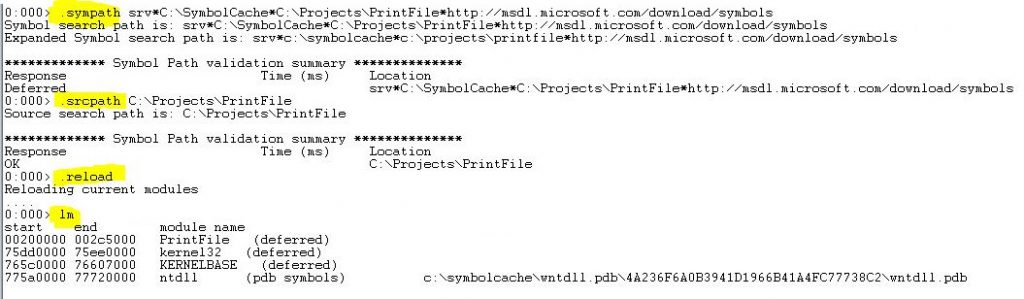
First thing we have to go it tell WinDbg where symbols (pdb) file is located. If your project is in C:\Projects\PrintFile directory then command will look like this:
.sympath srv*C:\SymbolCache*C:\Projects\PrintFile*http://msdl.microsoft.com/download/symbols
The parameter we set consist of three parts: folder where WinDbg will cache pdb files, path to your symbols, path to Microsoft symbol server. For the simple test as ours we don’t really need Microsoft symbols, but in real life you will need them.
Next we set path to source files:
.srcpath C:\Projects\PrintFile
If you set of change paths you might need to reload symbols:
.reload
Debugger allows you to execute one line at a time and see which path you application follows. But we have to start somewhere. That’s what breakpoints are – they allow to run your application and stop in any location. In our case we want to start from the beginning – at the main function.
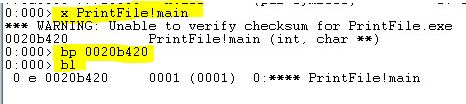
So first thing we need to is to find function main:
x PrintFile!main
Format is <Module>!<name> and it allows to use search wildcards:
Output is in format: address symbol
Now that we know main function address we can create a breakpoint:
bp 0020b420
Let’s check if breakpoing were created, bl will show you list of all breakpoints:
bl
We can also use function name to create breakpoint:
bp @@(PrintFile!main)
Now let’s start our application:
g
If all paths were setup correctly window with a source code should appear and there will be a red marker and the beginning of function main:
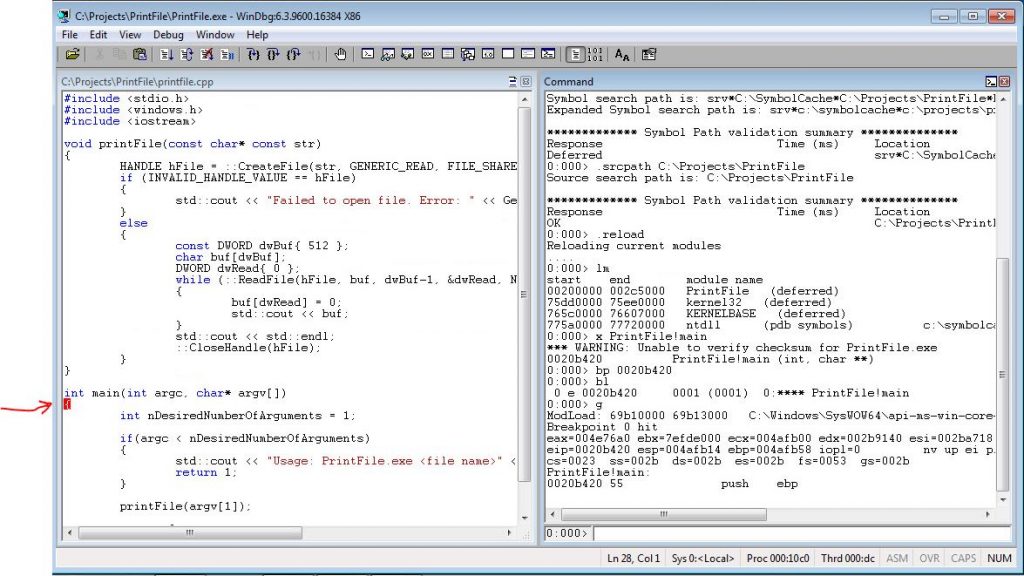
Following commands allow you to navigate through code:
p – step over
t – step into
gu – step out
Press p <enter>, p <enter>… – until we come to the if statement.
Let’s examine local variables before proceed:
dv
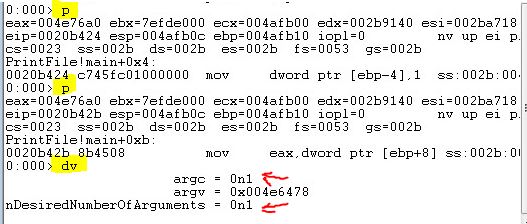
As you can see argc is 1 and our condition (nDesiredNumberOfArguments) is 1. How could it be – we didn’t supply any command line arguments but we have one parameter? Let’s examine what exactly what we have as a argv argument:
db 0x004e6478
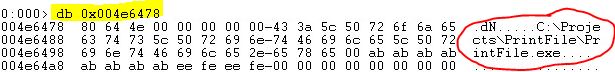
We see memory dump starting with address 0x004e6478 and you immediately could see that there is a full path to our executable: “C:\Projects\PrintFile\PrintFile.exe”. As you should know – main function receives executable full path as a first value in argv array and all command line parameters (if any) comes next in the array.
But let’s proceed, let’s go to prinfFile function and go inside: p <enter>, t <enter>, p <enter>, p <enter> … until we reach if statement afrom CreateFile function. Step over and let’s check variables:
dv
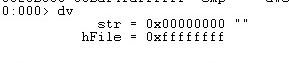
As you can see hFile is -1, which correspond to en error. And we can check what last error was:
!gle

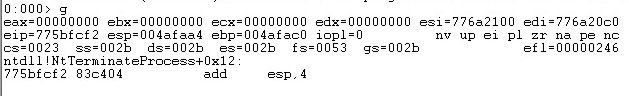
Click g to finish application.
To finish debug session, go to Debug menu and click Detach Debuggee
To see the list of most useful (for me at least) commands see this link.
Recommended reading material:
Memory Dump Analysis Anthology, Volume 1(As an Amazon Associate I earn from qualifying purchases)